skip to Main Content

TRY IT FOR FREE self service BI software | data visualization | data discovery TRY IT FOR FREE self service BI software | data visualization | data discovery

Data discovery – open live demo BusinessQ Dashboard

Data discovery – open live demo BusinessQ Dashboard

Data discovery – open live demo BusinessQ Dashboard

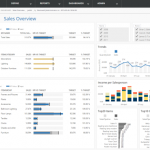
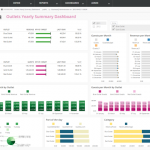
Data discovery – LIVE DEMO – Click the thumbnail to open live demo BusinessQ Dashboard – BusinessQ has built-in best practice data visualization.

Data discovery

Why BusinessQ?
Every company, no matter how big or small, needs Reports.

Daily, Monthy, Yearly Reports, Performance reports, Controlling, Reports for administration, Reports for Management…

Use BusinessQ to get new reporting ideas, to create Reports and share them. Create appropriate Dashboards and take action on what is really important; stay up-to-date with what’s going in your business.

BusinessQ is all about making that easy and fun while maintaining data visualization integrity.

Spend time reading and understanding your Reports, not making them!
If Data is poorly represented, the BI project will fail
Without proper data visualization your are stuck with mere numbers and you’ll spend hours trying to understand them
Raw data can only be valuable when it is understood, and not just when it is available
Our brain is pattern-detecting software; BusinessQ is leveraging that fact
BusinessQ has built-in best practice data visualization
Business Dashboards are not here to entertain managers, but to inform them

LIVE DEMO

If you want to “feel” complete BusinessQ demo environment, where you take a role of viewer, just click Live Demo button:

If you want to directly access BusinessQ dashboard / report, just click the thumbnail below.

They are based on our demo sales data.

Like what you see?

BusinessQ 16 Information Dashboard Example

BusinessQ 16 information dashboard example

BusinessQ 16 Sales Performance Overview Dashboard

BusinessQ 16 Sales Performance Overview dashboard

BusinessQ Sales KPI Dashboard Example

BusinessQ Sales KPI Dashboard example

BusinessQ Pivot Report

BusinessQ Pivot Report

Back To Top
×Close search
Search